You’ve probably felt this before. One post pops off, another disappears, and your analytics dashboard starts to feel like a slot machine instead of a strategy. If you’re building a serious body of work, daily views and short-term engagement only tell part of the story.
A better question is this. Which pieces in your library keep proving their value over time?
That’s where the idea behind h index calculate gets interesting. It comes from academia, but the logic is useful for creators too. Instead of asking whether you had one hit, it asks whether you’ve built a repeatable pattern of influence across your catalog.
What Is the H-Index and Why Should Creators Care
The h-index started in research, not media. It was formally proposed by physicist Jorge E. Hirsch in 2005 as a way to measure both the quantity and quality of a scholar’s output. Under Hirsch’s definition, a scientist has an h-index of h if h of their papers have at least h citations each, while the remaining papers have fewer citations, as explained by Columbia University Libraries’ overview of the h-index.
For academics, “citations” are the signal. For creators, the same mental model can help you think about durable influence. You might not be counting journal citations, but you are still trying to understand whether your body of work creates lasting reference value.

The creator version of the idea
Think about a podcast library, YouTube archive, or blog. One viral post can make you look bigger than you are. The h-index asks a tougher question. How many pieces have achieved a meaningful level of repeated recognition?
That makes it useful when you want to show:
- Authority across a body of work instead of one breakout moment
- Consistency in topics where you want to own the conversation
- Library strength that matters for partnerships, speaking, consulting, or licensing
Practical rule: A strong h-index mindset rewards depth and repeatability, not just spikes.
Why it matters beyond academia
Creators often borrow metrics from platforms without questioning what those metrics were built to do. Views measure attention. Likes measure reaction. The h-index style of thinking measures whether your catalog keeps earning validation.
That’s especially valuable if you’re trying to become more evidence-based about what belongs in your “best work” bucket. If you also care about citing reliable material and building a stronger research habit, this short guide on what makes a source credible is worth keeping handy.
The biggest shift is psychological. You stop asking, “Did this post win today?” and start asking, “Did this piece become part of my long-term influence?”
Calculate Your H-Index Manually with a Worked Example
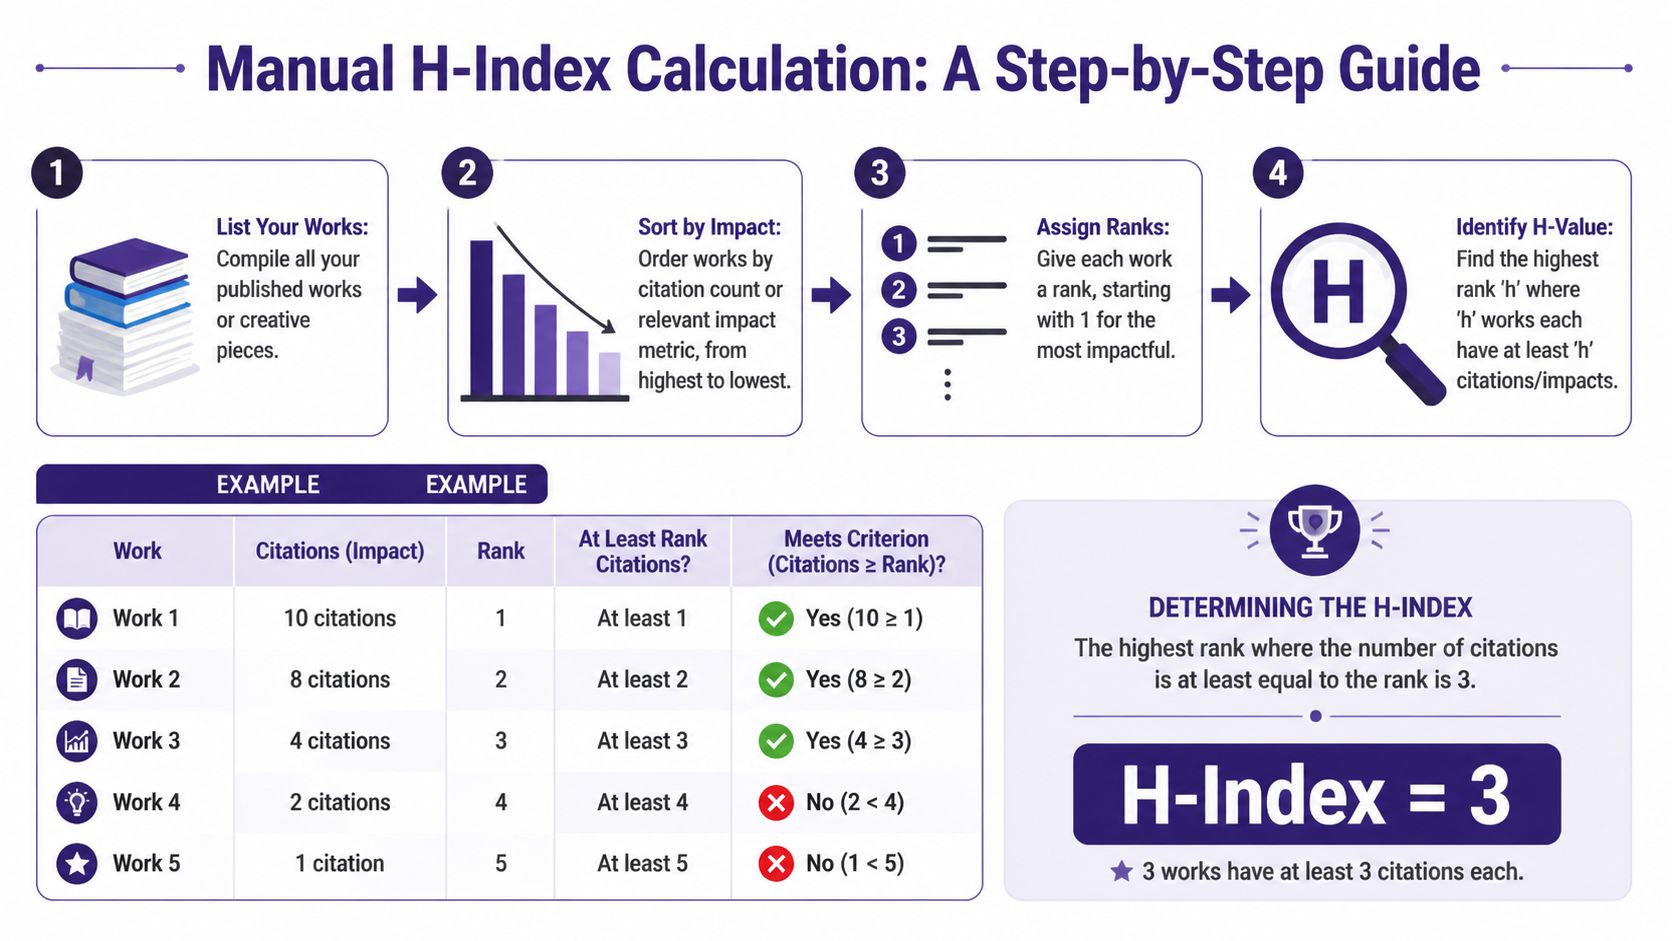
Manual calculation looks technical at first, but it’s simple once you see it. The core rule is to sort items by impact from highest to lowest, then find the last position where the impact count is at least equal to the rank. That method is summarized in Wikipedia’s h-index explanation.
Let’s use a creator-friendly example. Say you host a podcast, and you want to apply h-index logic to episode backlinks, mentions, or citations in newsletters and blogs. We’re using those as stand-ins so the logic feels familiar.
A simple ranked example
Here’s your sorted list of episode impact counts:
| Rank | Episode | Impact count |
|---|---|---|
| 1 | Episode A | 10 |
| 2 | Episode B | 8 |
| 3 | Episode C | 4 |
| 4 | Episode D | 2 |
| 5 | Episode E | 1 |
Now compare each rank to the impact count beside it.
- Rank 1 works because 10 is greater than or equal to 1
- Rank 2 works because 8 is greater than or equal to 2
- Rank 3 works because 4 is greater than or equal to 3
- Rank 4 fails because 2 is less than 4
- Rank 5 also fails because 1 is less than 5
So the h-index here is 3. You have 3 pieces that each reached at least 3 impact signals.
Where people get confused
Most mistakes happen when people try to eyeball it instead of checking rank against count.
Don’t ask, “What’s the average?” Ask, “How far down the ranked list do the counts keep up with the position number?”
A few common errors:
- Using unsorted data. The list must go from highest impact to lowest.
- Giving credit to one huge outlier. A single blockbuster episode doesn’t raise the h-index by itself unless enough other pieces also clear the threshold.
- Stopping at the wrong point. If rank 4 fails, you don’t round up. You go back to the last rank that worked.
Why creators should care about the manual method
You won’t hand-calculate this every week, but doing it once teaches you what the number means. It also sharpens your editorial judgment. You start seeing which assets are supporting your authority and which ones are just sitting in the archive.
That same habit matters in other parts of the business. For example, when you determine your customer acquisition cost, the value isn’t only in getting a number. It’s in understanding the mechanics behind the number, so you can act on it.
Manual h index calculate works the same way. Once you understand the rule, the metric stops feeling mysterious and starts becoming useful.
Find Your H-Index Instantly with Automated Tools
This shouldn’t be calculated by hand more than once. After that, automated tools are faster and usually better for ongoing tracking.
The main names you’ll hear are Google Scholar, Scopus, and Web of Science. They all calculate h-index style metrics from their own indexed records, which means they don’t always agree.

Google Scholar
Google Scholar is the easiest starting point for most researchers because it’s widely accessible and easy to scan. If you have a profile, your h-index is typically visible right on the profile page.
Google Scholar tends to cast a wider net than more curated databases. For creators and hybrid professionals, that broad coverage can feel appealing because it may capture more of your footprint. It also makes profile cleanup important. If the wrong works are attached to your name, the metric gets muddy.
If your work involves research-heavy publishing, video essays, or educational content, this guide to AI tools for literature review pairs nicely with Google Scholar workflows.
Scopus and Web of Science
Scopus and Web of Science are more selective. They’re often used in formal research evaluation because their indexing is more controlled.
That usually means:
- Cleaner records for academic comparison
- Less coverage of nontraditional or gray literature
- Different results from Google Scholar
If you’re checking your score in these tools, search for your author profile first. Then verify that the publications attached to your profile are yours. Name ambiguity is a real problem, especially if you have a common surname or publish across different formats.
A short walkthrough can help if you want to see the interfaces in action:
Why the numbers change
Different databases index different materials. That’s the whole story.
Google Scholar is broader. Scopus and Web of Science are tighter. So if you search your name in all three, you’re not necessarily getting contradictions. You’re getting three versions of your impact based on three different collections of records.
That’s why a smart creator or researcher doesn’t say, “My h-index is X,” as if there’s one eternal number. They say, “My h-index is X in this database, on this date.”
What Your H-Index Score Actually Means
A score without context is noise. The h-index is useful only when you interpret it against career stage and field.
According to Paperpile’s explanation of good h-index ranges, typical progression often looks like 3-5 for early-career researchers in 0-5 years post-PhD, 8-12 for mid-career researchers in 5-15 years, and 15+ for established researchers. The same source notes that STEM fields typically show 40-60% higher h-indices than humanities disciplines because citation norms differ.
Why the same number can mean very different things
An h-index isn’t a universal grade. A score that looks ordinary in one field may be impressive in another.
That matters for creators too. If your niche has a slow publishing rhythm, smaller communities, or fewer places where your work gets cited or linked, your benchmark should look different from a high-volume field with larger networks and faster feedback loops.
A useful interpretation starts with comparison to peers in your own lane, not random people with bigger numbers.
A quick context table
| Context | Typical interpretation |
|---|---|
| Early-career | Building a base of work that earns repeated recognition |
| Mid-career | Showing consistency across a larger catalog |
| Established | Demonstrating sustained influence over time |
| STEM-style environments | Citation counts often accumulate faster |
| Humanities-style environments | Lower raw scores can still reflect strong standing |
What the number does tell you
The h-index is strongest when you use it to answer practical questions:
- Do I have depth in a topic?
- Is my library producing repeat winners or one-off hits?
- Am I building durable authority, not just temporary reach?
What it does not tell you
It doesn’t tell you whether your best work is original, emotionally powerful, or commercially smart. It also doesn’t tell you whether one exceptional piece changed the conversation.
That’s why this metric works best as one lens, not the whole mirror. It gives you a disciplined way to measure repeat impact. It doesn’t replace judgment.
The Hidden Pitfalls and Limitations of the H-Index
The h-index looks neat because it turns a messy body of work into one number. That neatness is also the trap.
A major limitation is database dependency. H-index values can vary across Web of Science, Scopus, and Google Scholar because each platform indexes different publications and citations. The University of Queensland notes that one documented case showed an author with an h-index of 10 on Web of Science five years post-PhD, while other databases showed different values in the same broader profile context, as described in UQ’s guide to calculating h-index.

The metric is only as complete as the database
If one system tracks books, preprints, or broader web material and another doesn’t, your score will move. That doesn’t mean one platform is lying. It means each one defines your record differently.
For creators, the equivalent problem is obvious. A platform-native metric can ignore podcast mentions, newsletter references, syndication, or off-platform influence. If you rely on only one dashboard, you’ll get a narrow story.
The h-index misses certain kinds of excellence
It also has structural blind spots:
- Early-career disadvantage. Newer researchers or creators haven’t had enough time for recognition to accumulate.
- Outlier blindness. One massive hit doesn’t count as much as many solid performers.
- Co-authorship complexity. The number doesn’t tell you how much of each work was yours.
- Cross-field unfairness. Different disciplines produce very different citation patterns.
The h-index is good at measuring steady influence. It’s weaker at recognizing breakthrough moments, emerging talent, and unusual careers.
Use it as a checkpoint, not a verdict
When people turn the h-index into a status symbol, they usually stop asking better questions. What kind of work gets cited? Which topics travel? Which formats create durable reference value?
Those questions are where strategy lives. The metric can support that strategy, but it can’t substitute for it.
Beyond the H-Index Unlocking Your Content's Value
The true value of h index calculate isn’t the score itself. It’s the editorial clarity that comes after.
Once you know which pieces in your library keep earning attention, references, or reuse, you can make smarter moves. You can expand those topics into series, update them into premium assets, turn them into scripts, or package them for distribution across platforms. If you work in audio, these repurposing strategies for spoken content are a strong next step because they turn durable ideas into multiple formats without forcing you to start from zero.
A big gap in h-index guidance is that most resources don’t offer enough discipline-specific context, which is one reason generic score-chasing falls short, as discussed in this analysis of field differences in h-index interpretation. The lesson for creators is simple. Don’t stop at a borrowed metric. Build a contextual understanding of your own archive.
Turn measurement into action
A useful workflow looks more like this:
- Audit your library to identify work with repeat influence
- Group related assets so patterns become visible
- Prioritize repurposing around proven themes
- Organize research and source material so future projects build on what already works
If your archive is messy, start with a system for organizing research papers and knowledge assets. The cleaner your content library is, the easier it becomes to spot what deserves a second life.
The h-index gives you one disciplined lens. Your real advantage comes from using that lens to make your library more valuable next month than it was today.
If you want to turn old articles, videos, podcasts, and research into usable strategic assets, Contesimal helps you organize your content library, surface high-value patterns, and collaborate around what your archive already knows. It’s built for teams and creators who want more than storage. They want to find opportunities, repurpose intelligently, and create new value from the work they’ve already done.