So, you have a library full of content—podcast transcripts, video comments, blog posts, you name it. Each one is packed with rich, human stories just waiting to be understood. But how do you actually unlock them and create new value from the assets you already own?
Learning how to analyze this kind of qualitative data isn't just some dry academic exercise. It’s the secret to figuring out why your audience engages, clicks, and sticks around. For creators moving from hobbyist to professional, this is how you get past the view counts to discover what your audience truly values, reignite your content library, and turn it into a money-maker.

For creators, marketers, and publishers, this is where the real magic happens. By digging into the words and feelings hidden in your content, you can spot emerging trends, confirm your creative hunches, and get crystal-clear direction for your next big project. This guide will help you organize your library, understand your audience, and take action.
Why Qualitative Analysis Is a Game-Changer for Creators
Think about the last time you launched a new video series. You probably watched the view counts like a hawk. Those numbers—the quantitative stuff—tell you what happened, but they can't tell you why. That’s where qualitative data comes in, helping you generate more audience across platforms.
- Spot Hidden Opportunities: Audience comments can shine a light on unexpected pain points or desires, sparking ideas for content you never would have thought of on your own. It's how you experiment to find the next viral thing.
- Sharpen Your Content Strategy: When you understand the specific language your audience uses, you can craft titles, descriptions, and scripts that hit differently and connect on a much deeper level.
- Build a Real Community: Analyzing feedback and acting on the themes you find shows your audience they've been heard. That's how you build fierce loyalty and engagement.
For instance, a YouTuber might notice viewers are constantly mentioning a specific editing style in the comments. Analytics alone would completely miss this. But that one qualitative insight gives them a clear, actionable way to improve their next video and give the audience more of what they love. Truly understanding the stories hidden within feedback is a skill, and it's crucial to get good at analysing survey data.
This process turns your passive content archive into an active source of strategic insights that actually fuel growth. Instead of guessing what to create next, you’ll have a roadmap built from your audience's own words.
Ultimately, this guide is here to demystify all of it. We'll show you how to organize and make sense of this goldmine of information, turning old content into a money-maker and creating endless value from the library you’ve already built. It's time to take decisive action.
Getting Your Content Ready for Analysis
Before you can start digging for those game-changing insights, you’ve got to get your hands dirty. Think of it like a chef prepping ingredients before the dinner rush; you need to clean, chop, and organize everything so it's ready to go. For creators, podcasters, and content marketers, this means turning a chaotic mix of podcast MP3s, YouTube comments, and article drafts into a clean, workable dataset.
Trust me, this prep work is a non-negotiable first step. Taking the time to get organized now ensures you’re working with clear, consistent information later on. It prevents valuable nuances from getting lost in the shuffle and saves you from massive headaches down the road.
From Raw Files to a Clean Slate
Let’s be real, your content library is probably a mishmash of different formats. You've got audio files, video links, blog post text, and maybe even screenshots of social media feedback. The goal here is to wrangle all this stuff into a consistent, text-based format.
This whole process is often called data cleaning and preparation, and it's absolutely foundational. It really boils down to a few key activities:
- Transcription: This is the big one for anyone working with audio or video. You have to convert the spoken words from your podcasts, vlogs, and interviews into written text. Accurate transcripts are the bedrock of your entire analysis.
- Consolidation: Next, pull all your relevant text into one place. This could be as simple as copying and pasting YouTube comments into a spreadsheet or compiling audience emails into a single document.
- Formatting: Time to standardize everything. Get rid of weird characters, fix obvious typos, and make sure the layout is simple and easy to read. This makes the data much easier for you—and any software you use—to actually process.
If you're just starting out, this might seem like a lot of work, but it’s a crucial step that pays off big time. You can take a deeper dive into qualitative research and content analysis to see just how important this groundwork is.
Structuring Different Content Types
Not all content is created equal, right? A structured interview transcript is way easier to handle than a sprawling, unstructured YouTube comment thread. Let's break down how to approach a few common types.
For podcasts and videos, once you have your transcripts, think about adding a bit more structure. You could add speaker labels (like "Host:" or "Guest:") or even timestamps. This context is vital for understanding who said what and when they said it.
When you're dealing with audience comments or feedback, it's a huge help to add columns for metadata. For a YouTube comment, for instance, you might want to track:
- Which video it came from.
- The date the comment was posted.
- How many likes it received.
This extra information adds powerful new layers to your analysis, allowing you to spot patterns you'd otherwise miss, like seeing if feedback on one video is totally different from another.
This is a fantastic way to start organizing your library to uncover new insights.
Platforms like Contesimal are actually built to help you manage and search through these huge, varied content libraries in a much more organized way. For creators transitioning from hobbyist to professional, this is the kind of system that lets you move from just having a lot of content to having a valuable, searchable knowledge base you can learn from and collaborate on.
Key Takeaway: The goal at this stage isn't to analyze anything yet. It's to create a single source of truth—a clean, organized, and consistently formatted dataset that's primed and ready for the fun part: coding and finding themes.
The shift toward digital tools has completely changed how we can approach this. For content organizations, the ability to analyze podcast transcripts, video descriptions, and audience feedback at scale is a massive advantage. In fact, research shows that around 64.6% of big qualitative data analysis projects now happen in high-income countries, largely driven by these new capabilities. This prep work truly sets you up for a much smoother, more accurate analysis journey.
Finding Patterns with Coding and Themes
Alright, your content is prepped and organized. Now for the fun part: turning all that raw text, audio, or video into actual, usable patterns. This is where you really start to see what your audience is telling you. The main process here is coding, which is just a fancy term for labeling and sorting chunks of your data.
Think of it like sorting a giant bin of LEGOs. Right now, it’s just a chaotic jumble of colors and shapes. Coding is your way of putting all the red bricks in one pile, all the blue ones in another, and so on. Except with your content, you’re not sorting by color—you're sorting by ideas, feedback, and feelings.
This is the bridge between a messy pile of comments and clear, actionable insights that can guide your next creative project. It’s how you start making sense of all the noise and build on successful concepts.
Choosing Your Coding Approach
Before you start tagging every sentence, you need a game plan. There are two main ways to tackle coding, and the one you choose really depends on your goals.
- Deductive Coding (Top-Down): This is where you start with a list of codes you've already decided on. It's perfect when you have a specific hypothesis you want to test or you're looking for themes you already expect to find.
- Inductive Coding (Bottom-Up): Here, you let the codes emerge naturally from the data itself. This approach is much more exploratory and is fantastic for discovering unexpected patterns or topics you hadn't even thought about.
Honestly, most creators find a mix of both works best. You might start deductively, looking for mentions of a new product you just launched, but then switch to an inductive approach to see what other organic conversations are popping up around it.
This quick flowchart shows how a solid prep process is the foundation for any good coding effort.
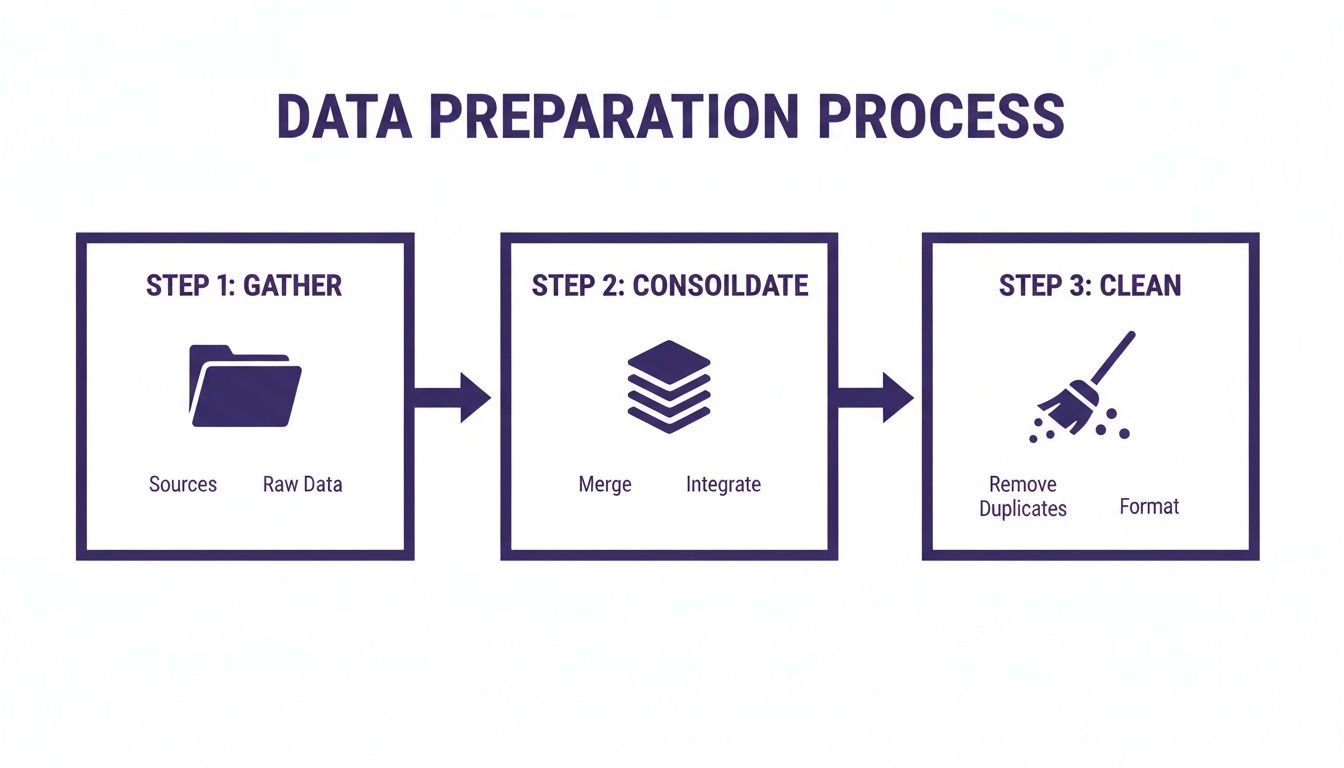
As you can see, getting everything gathered, consolidated, and cleaned up before you start is what makes the actual analysis possible.
Deductive vs Inductive Coding for Content Creators
Deciding between a top-down or bottom-up approach can feel a bit abstract, so let's break it down with some real-world examples for creators.
| Aspect | Deductive Coding (Top-Down) | Inductive Coding (Bottom-Up) |
|---|---|---|
| Starting Point | You have a pre-made list of codes based on your goals. | You start with a blank slate and create codes as you read. |
| Best For | Answering specific questions or validating a theory. | Discovering new ideas and unexpected audience feedback. |
| Creator Example | You want to know if viewers liked the new editing style in your latest video, so you create codes like "Editing Praise" and "Editing Critique." | You read all your YouTube comments and notice a recurring joke about your cat walking past the camera. You create a new code: "Cat Cameo." |
| Pros | Fast, focused, and directly answers your questions. | Uncovers authentic, surprising insights you didn't know to look for. |
| Cons | You might miss important themes you weren't looking for. | Can be more time-consuming and less structured. |
Ultimately, there's no "right" answer. The best method is the one that gets you the insights you need to make better content.
From Codes to Actionable Themes
Coding is really just the first layer. Your end goal is to group those individual codes into bigger, more meaningful themes. A theme is the story that your codes are telling when you look at them all together. It’s the "so what?" behind all the data.
Let’s go back to our podcaster example. You might end up with these specific codes from listener feedback:
- "Love the new intro music!"
- "Sound levels were off in episode 25"
- "Please fix the audio hum"
- "The background music is distracting"
When you cluster these together, a clear theme emerges: Audio Production Quality. This theme is way more powerful than any single comment. It tells you that your audience cares deeply about the technical side of your show, giving you a clear area to focus on for improvement. You've just turned scattered comments into a strategic priority.
As you start identifying themes, consistency is key. Keep a simple document—often called a codebook—to define what each code and theme means. This makes sure you apply them the same way across all your content, which is especially important if you have a team helping you out. As your content library grows, finding the right tools for qualitative data analysis will be a lifesaver for managing all this without getting buried.
The trick is to look for repetition and weight. When you see a pattern showing up again and again across multiple videos or podcast episodes, you’ve probably hit on a theme worth paying attention to. That’s your audience giving you a direct line to creating more of what they love.
Using AI to Accelerate Your Analysis
Let's be honest, manually sifting through hundreds of hours of video transcripts or thousands of YouTube comments isn't just tedious—it's completely impractical for a growing creator. This is where AI completely changes the game for qualitative data analysis.
It’s not about replacing your creative intuition. It's about giving that intuition a massive efficiency boost. Imagine being able to process your entire content library in minutes, not weeks. AI-powered tools can automate the grunt work—like transcription, initial coding, and even sentiment analysis—freeing you up to focus on the high-level strategic thinking that actually grows your channel.
This is the future of content strategy: a healthy and seamless collaboration between humans and AI where everyone benefits.
Automating the Heavy Lifting
The first and most obvious win with AI is sheer speed. Think about all the time it takes just to get your raw content ready for analysis. AI tools can handle these foundational tasks almost instantly, turning what was once a massive bottleneck into a smooth workflow.
A few key areas where automation makes a huge difference:
- Transcription: AI services can convert hours of your audio or video into text with shocking accuracy. This alone saves you countless hours of manual work or the steep cost of human transcription.
- Initial Coding: You can use AI to perform a first pass of coding, automatically tagging mentions of specific topics, products, or keywords you're tracking across your entire content library.
- Sentiment Analysis: Curious how your audience really feels about that new series? AI can scan thousands of comments and classify them as positive, negative, or neutral, giving you a high-level emotional snapshot in seconds.
This initial sweep gets you straight to analyzing patterns instead of getting bogged down in manual prep. An AI research assistant can jumpstart your process and get you to insights much faster. You can find a deeper breakdown of how an AI research assistant can improve your workflow in our guide.
The real value here is scale. An AI can do in an afternoon what would take a human researcher months to accomplish, surfacing patterns across a vast library that would be impossible to spot otherwise.
Human Oversight Is Still a Must
While AI is incredibly powerful, it isn't perfect. It can easily miss sarcasm, cultural nuances, or the subtle context behind an inside joke that’s unique to your community.
That's why the best approach is a partnership. Let the AI handle the brute-force processing, and then use your human expertise to interpret and refine the results.
Think of AI as your junior analyst. It organizes everything and presents the high-level findings, but you—the creator and expert on your own audience—make the final call. You’re the one who can catch the subtle irony in a comment that an algorithm might mistakenly flag as negative.
Artificial intelligence has certainly improved efficiency in qualitative analysis, with tools now automating coding and theming tasks that once required enormous human effort. The 2024 GRIT Report highlights strong industry optimism about this, showing that companies are more confident in their growth thanks to spending on this kind of technology. AI excels at rapidly sifting through unstructured data—like interview transcripts—to surface insights almost instantly.
For anyone curious about the foundational technology that powers this kind of analysis, you can explore the capabilities of LLMs.
Platforms like Contesimal are built on this exact idea of seamless collaboration. The software helps you organize your entire library, letting AI do the initial discovery so you can focus on what matters: creating meaning and generating real value from the patterns you find.
Turning Your Findings into Actionable Reports
Let's be honest. Insights are only valuable if they’re understood and acted upon. After all that hard work of coding and identifying themes, the final—and most critical—step is turning your findings into something compelling and easy to digest. This is where you craft a story from your data that can inform your content strategy, spark ideas for your creative team, or get buy-in from stakeholders.

The goal here is to move way beyond messy spreadsheets and endless lists of quotes. A great report tells a story, making the data stick and inspiring people to do something with it. You're not just showing what you found; you're explaining why it matters for your content and your audience.
Visualizing Your Qualitative Insights
Words are powerful, but visuals make complex ideas click. Presenting your findings in visually engaging ways can be the difference between a report that gets filed away and one that gets everyone talking. Visuals help people instantly grasp connections and patterns that are tough to spot in a wall of text.
For content creators, this is a game-changer. You can use visualizations to highlight key takeaways for your team or even to share juicy insights directly with your audience.
Here are a few effective ways to visualize your data:
- Theme Maps: Think of these as mind maps for your data. They show your core themes and how they branch out into smaller sub-themes and specific codes. It’s a fantastic way to give a clear, high-level overview of your entire analysis.
- Word Clouds: A classic for a reason. This simple tool highlights the most frequently used words in your dataset, offering a quick, at-a-glance summary of the dominant topics popping up in your audience's feedback.
- Customer Journey Maps: If your data touches on user experience, plotting it out visually is a must. You can map audience emotions, pain points, and "aha!" moments across their interactions with your content or brand.
These methods turn abstract themes into tangible visuals that pack way more punch than a simple list. They help your team see the big picture immediately.
Weaving a Narrative with Your Data
The best reports don't just list findings—they tell a story. Your job is to connect the dots between the themes you’ve uncovered and the real-world goals of your channel, podcast, or publication. Every insight should tie back to a business objective, whether that's boosting audience engagement, improving content quality, or spotting new ways to monetize.
The most crucial part of reporting is translating your newfound understanding of the 'why' into concrete next steps. Your report should clearly answer the question, "So what do we do now?"
For instance, instead of just stating, "Listeners mentioned 'sound quality' 50 times," you can frame it as a narrative:
"Our deep dive into listener feedback revealed a consistent theme around 'Audio Production Quality.' While fans absolutely love our guests, distractions like audio hum are pulling them out of the experience. We believe improving this could directly impact listener retention, a key goal for us this quarter."
This approach grounds your findings in reality and gives your team a clear, compelling reason to act.
Creating a Clear and Actionable Summary
Every single report should end with a punchy, actionable summary. This is the section everyone will read, so it needs to be crystal clear. Ditch the jargon and focus on translating your insights into specific, no-nonsense recommendations.
Your summary should do three things, and do them well:
- Restate the most important themes in simple, direct language.
- Explain the implications of these themes for your content strategy.
- Provide concrete next steps or recommendations for your team.
This is your bridge from analysis to action. With a well-crafted report, you're not just sharing data; you're handing your team a roadmap to make smarter, more audience-focused decisions. Platforms like Contesimal can help organize this knowledge, making it easier for your team to rally around these insights and generate new value from your content library.
Tying Qualitative Insights to Your Metrics
Getting to the "why" behind your audience's behavior is a massive win. But it becomes a true game-changer when you pair it with the numbers you're already tracking. When you start connecting your qualitative findings with quantitative metrics like views, downloads, and click-through rates, you finally get the complete picture of your content’s performance. This blend of data lets you move beyond gut feelings and actually validate your creative instincts with hard numbers.
This mixed-methods approach solves a problem that trips up a ton of creators. Your qualitative analysis tells you why people do what they do, while your quantitative data proves it with cold, hard stats. Combining these two research styles is becoming the new standard for creators and brands who want to truly understand their impact. If you want to dive deeper, you can explore future trends in qualitative research on discuss.io.
Connecting the Dots Between Comments and Clicks
Let's make this real. Say you're a podcaster, and your analytics show a huge listener drop-off at the 15-minute mark of a specific episode. The numbers tell you what happened, but that's where the story ends. This is where you pull out your qualitative data—episode comments, social media DMs, or survey responses—to figure out why.
Suddenly, you spot a pattern. A bunch of comments mention a guest's audio was crackly or that the conversation got way too technical. Boom. You've just found a clear, actionable reason for the drop-off. This connection lets you diagnose the real problem and make specific tweaks your audience will notice and appreciate.
Validating Your Creative Direction with Data
This combined approach is also your secret weapon for making gutsy strategic moves with confidence. Imagine you're a YouTuber trying out a new, faster editing style. You dig into the comments and see a clear theme of excitement, with viewers calling the new style “more engaging” and “super energetic.”
Key Takeaway: Pairing qualitative themes with quantitative spikes gives you undeniable proof that your creative risks are paying off. It's the ultimate validation for your content strategy.
Now you check your metrics for those videos. You see a 15% jump in average view duration and a way higher like-to-view ratio than usual. The qualitative feedback gave you the context, and the quantitative data confirmed the positive impact. You now have a data-backed reason to go all-in on this new style.
This 360-degree view completely changes how you operate. Instead of guessing what works, you build a repeatable process for understanding and delivering exactly what your audience wants. For creators looking to go from hobbyist to pro, this kind of systematic approach is non-negotiable for growth. Platforms like Contesimal are built to help you manage this entire workflow, letting your team rally around these insights and squeeze new value out of your entire content library.
Your Questions Answered
Diving into the world of qualitative data can feel a bit murky at first, especially when you're trying to turn audience feedback into a rock-solid content strategy. Let's clear up some of the most common questions that pop up.
How Much Qualitative Data Do I Actually Need?
Forget about magic numbers. Seriously. The goal isn't to hit some arbitrary count of comments or interviews. Instead, you're looking for "saturation."
Saturation is that point where you stop hearing new ideas or seeing fresh themes. It’s when the feedback starts feeling repetitive, and you can practically predict what the next person is going to say.
For a YouTuber, this might happen after digging through a few hundred comments on your most important videos. If you're a podcaster analyzing interviews, you might hit saturation after 10-15 deep conversations on the same topic. The real aim is depth, not just piling up a mountain of data. Start small and only go bigger if you're still uncovering new insights.
What are the Biggest Mistakes People Make?
It’s easy to get tripped up when analyzing qualitative data, even for seasoned pros. Here are the three big pitfalls I see creators fall into all the time:
- Letting your bias run the show. We all have our own assumptions. The danger is letting them color how you interpret what people are saying. To fight this, you have to actively look for feedback that disproves what you think you know.
- Coding inconsistently. If you apply your codes differently from one day to the next, your results will be a mess. The simple fix? Create a "codebook"—just a quick guide defining each code and when to use it. It keeps you honest.
- Ignoring the context. A single comment pulled out of its original context can be completely misleading. Always, always consider the bigger picture—the specific video it was on, or the conversation happening around it.
Do I Need Fancy, Expensive Software for This?
Absolutely not. When you're just starting out or working on a smaller project, the tools you already have are more than enough.
You can get surprisingly far with Google Sheets or even a bunch of sticky notes. Spreadsheets are perfect for tracking juicy quotes and the codes you assign to them. At the end of the day, the process of analysis is what matters, not the tool you're using.
Of course, as your content library grows, trying to manage thousands of comments, transcripts, and video files in a spreadsheet becomes a nightmare. That’s where a platform like Contesimal comes in. It automates the tedious stuff like transcription and helps your team collaborate to turn your entire content history into your next big idea.
See how you can unlock the value in your content library with Contesimal.